Our first quality test of the new multi-spectral LED imaging setup
We have designed the PlantHive Smart Garden to be a state-of-the-art indoor farming chamber/personal food computer, which allows end-users to grow plants under optimized growth conditions, and thus get maximal yield and product quality. We are striving to transcends its initial purpose as an indoor farming appliance by adding imaging capabilities. Our team has implemented a multi-color LED panel and a suitable multi-spectral camera to optimize light quality for plant growth.
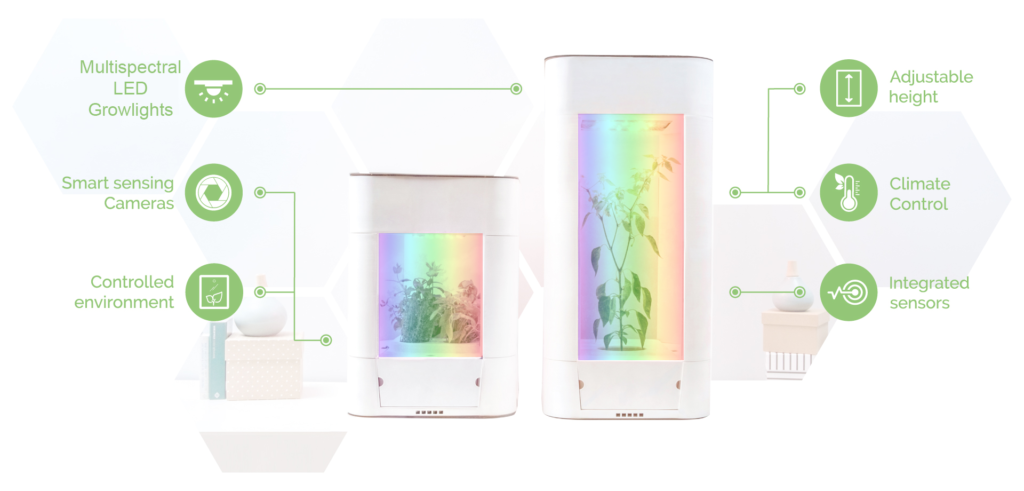
Temperature, humidity, light intensity, spectral light composition and day length can be fine-tuned using an intuitive smartphone app, whereas the app’s plant calendar keeps track of how well the user’s plants are growing and schedules plant care. The multi-spectral camera records images in the blue, green, red, and far-red spectral bands and allows for monitoring the growth stage, nutrient status and overall health of the plants. Images are organized in a library and visualized in PlantHive App, even when not at home
Using the multi-spectral measurement protocol, we are now able to extract phenotypic traits from recorded images, which are closely correlated with plant biomass, health and nutrition status. By monitoring plants during their grow cycle, we are able to display the dynamic changes and to keep track of individual planting schemes. This enables us to evaluate growth protocols and further optimize them.
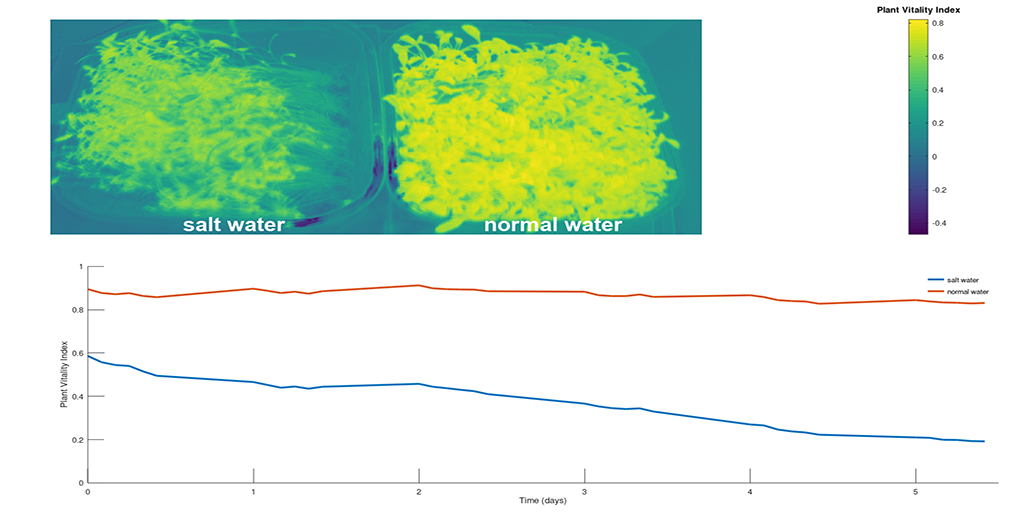
We are currently evaluating our new equipment in a long-term test series using real-world application scenarios. Here we want to share our first test scenario, where we subjected watercress to salt stress and monitored its response over 6 days.
The multi-spectral imaging setup of the PlantHive allows users to monitor growth, nutrition and health status of their plants, and helps optimize growth conditions continuously. Further, the PlantHive will also have the capability to be used for scientific applications related to digital plant phenotyping.
Interested? Share your digital phenotyping challenge with us and follow our next experiments. Send us an email at challenges[at]planthive.com
Authors: Tino Dornbusch, Federico Lucchetti, Vasileios Vallas